IR Information
(Unit: Millions of yen)
| (Consolidated) | FY2022 | FY2023 | FY2024 | FY2025 | FY2026 (forecast) |
|---|---|---|---|---|---|
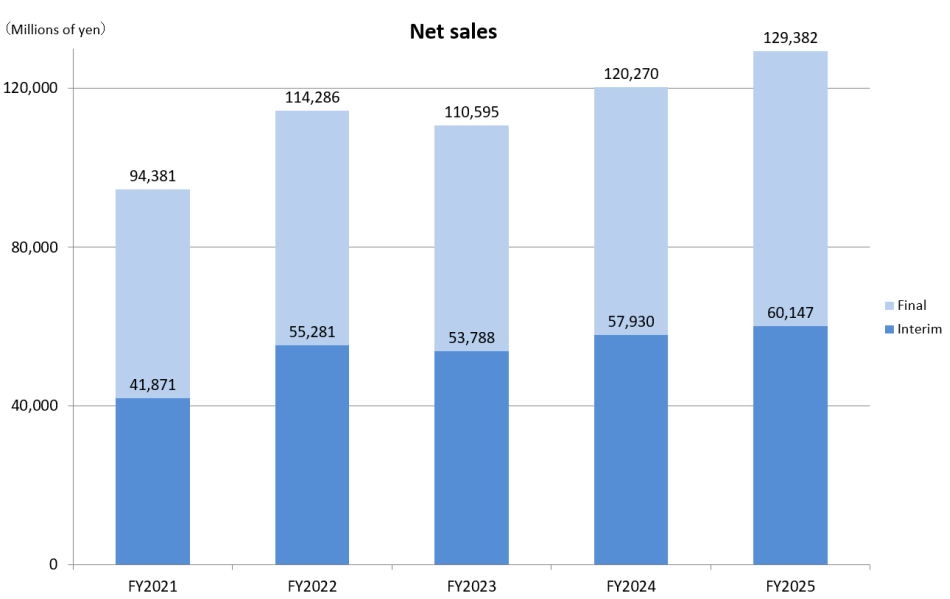
| Net sales | 114,286 | 110,595 | 120,270 | 129,382 | 138,000 |
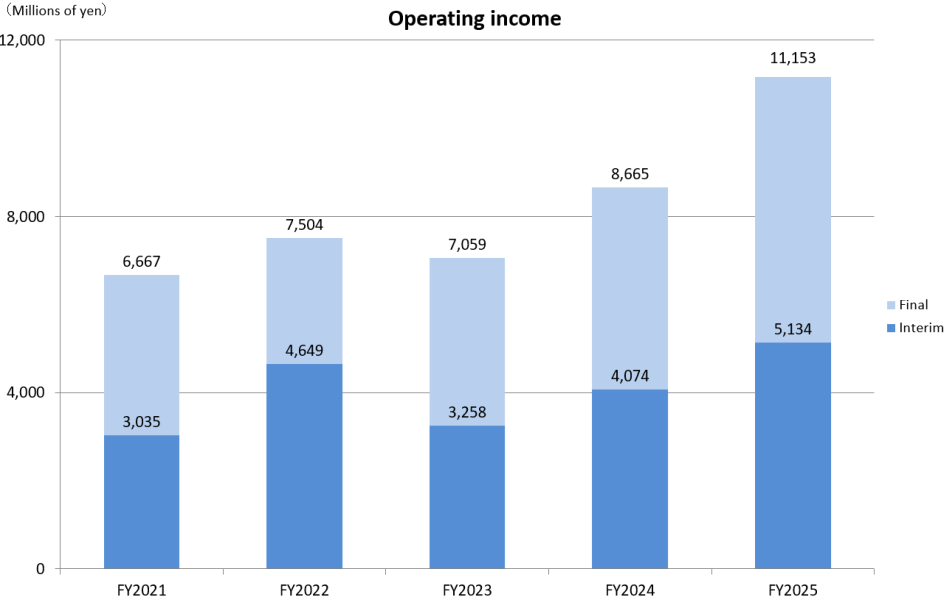
| Operating Income | 7,504 | 7,059 | 8,665 | 11,153 | 10,100 |
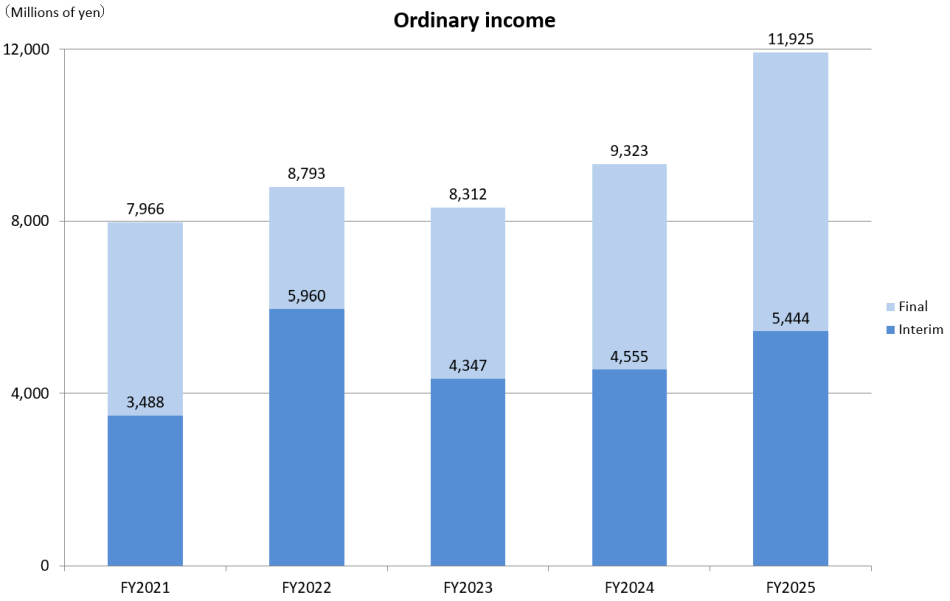
| Ordinary Income | 8,793 | 8,312 | 9,323 | 11,925 | 10,400 |
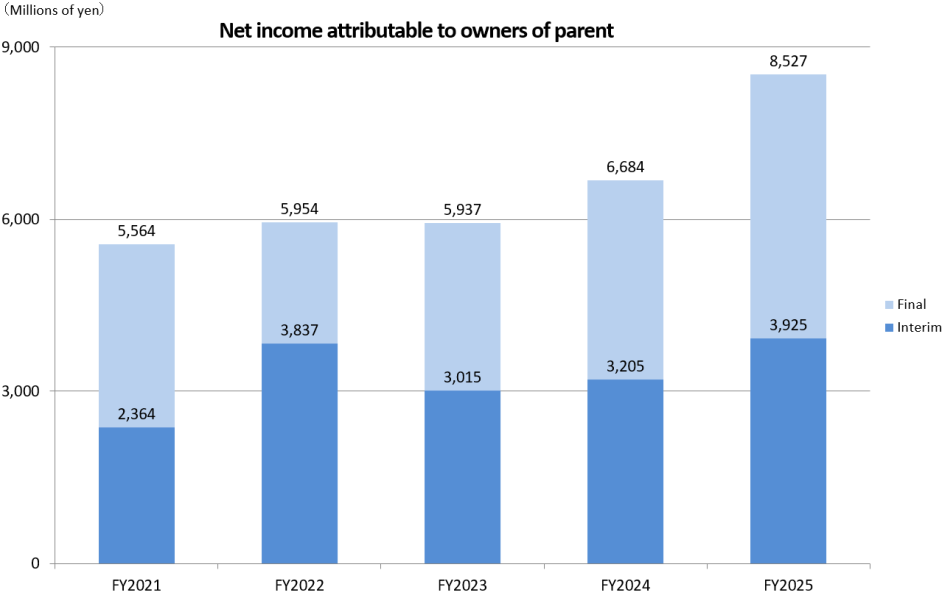
| Net income attributable to owners of parent | 5,954 | 5,937 | 6,684 | 8,527 | 7,000 |
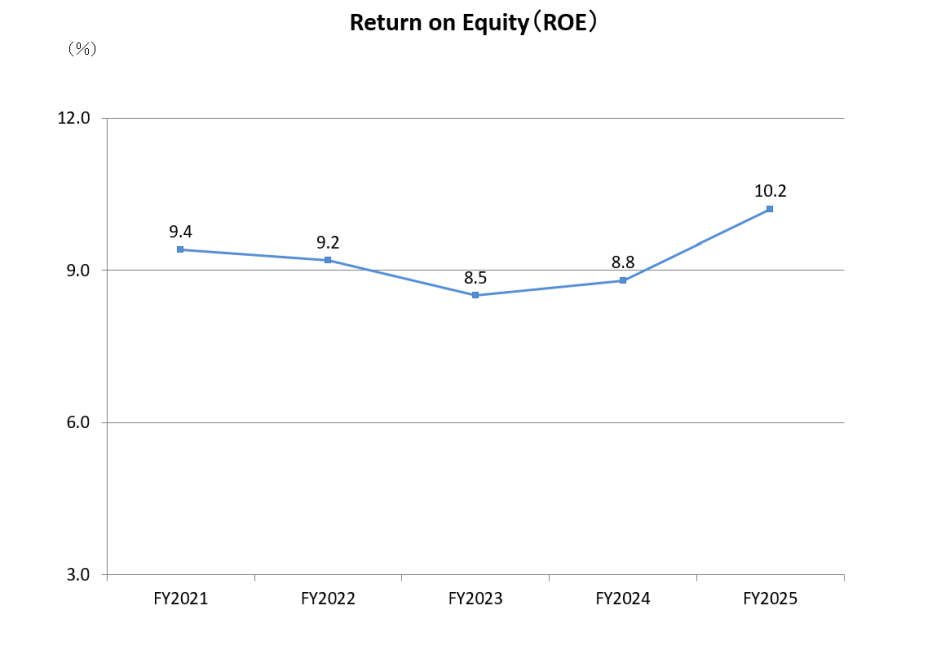
| ROE | 9.2 | 8.5 | 8.8 | 10.2 | ― |
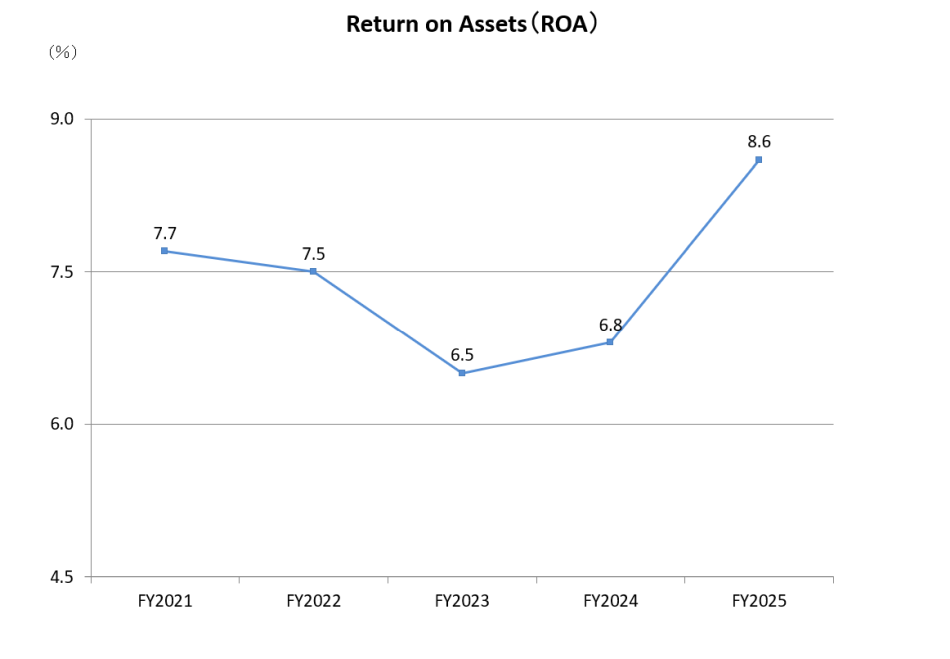
| ROA | 7.5 | 6.5 | 6.8 | 8.3 | ― |
- Return on Equity (ROE) = Net income attributable to owners of parent / Shareholder's equity×100
- Return on Assets (ROA) = Ordinary income / Assets×100
Dividends
Policy
In 2028 medium-term management plan(FY2024-FY2028),our basic policy is to distribute profits in line with performance while maintaining stable dividends,aiming for a consolidated payout ratio of 30% or more.